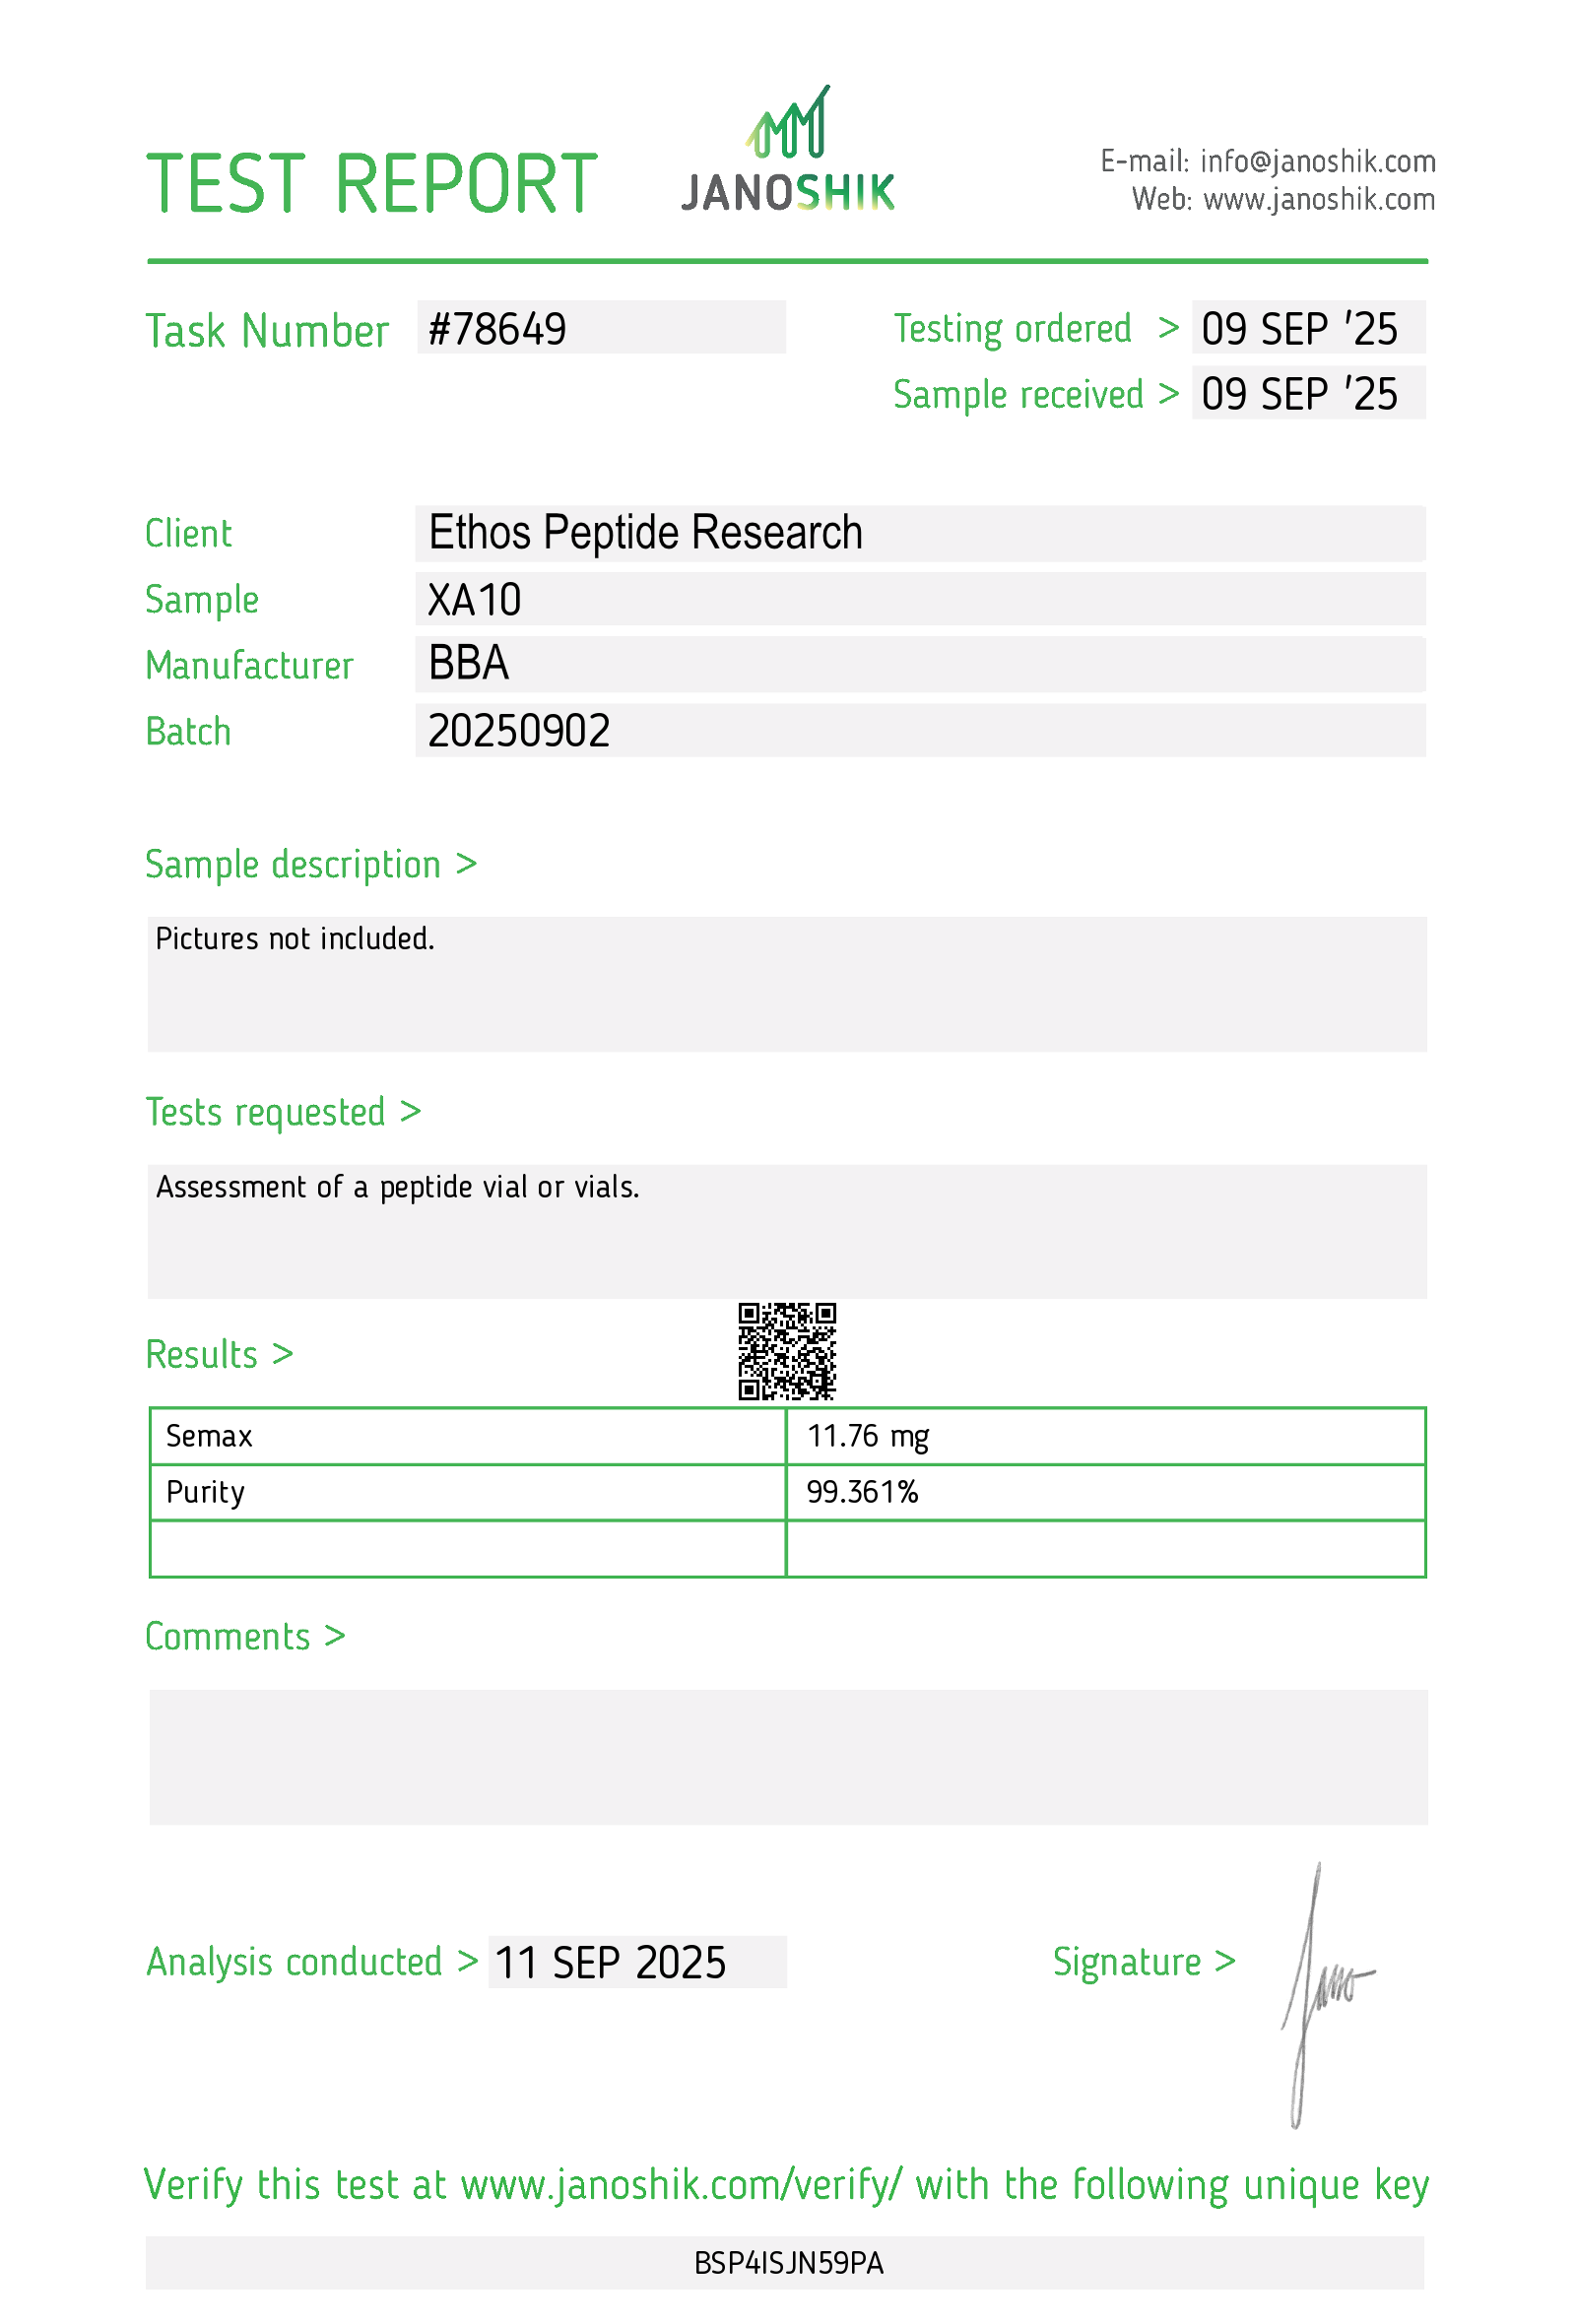


HPLC and mass spectrometry answer different questions about a peptide sample. HPLC separates components; a UV chromatogram reports detector response as those components pass. Mass spectrometry examines ions and can help identify the material behind a chromatographic signal. Neither a large peak nor a matching mass, by itself, answers every question about identity, purity and quantity (Preston and Phillips; Stoppacher and colleagues).
What does an HPLC chromatogram show?
A chromatogram plots detector response over time. For the familiar HPLC-UV purity calculation, the area assigned to the main peptide peak is expressed as a share of the integrated area of all included peaks. That is an area comparison, not automatically a measurement of how many milligrams of peptide are in the vial. The distinction is discussed in the 2016 peptide-standard study.
Read the result together with the detector and calculation details. If a report supplies only a percentage, ask what signal was integrated and what the percentage represents. Keep the chromatogram, peak labels and result table together rather than copying a single number into your records without its context.
Why is peak-area percentage not necessarily mass percentage?
Using a UV area percentage as a mass correction assumes that the main compound and impurities produce appropriately comparable responses per unit mass. Preston and Phillips explain that this assumption is not always valid. Their work distinguishes chromatographic response from an independently established amount, rather than presenting the two as interchangeable (primary paper).
This does not make chromatography unhelpful. It means a result should be described as the measurement actually made. Record “area percentage” when that is what the report states, and keep a separate field for measured content. Do not silently relabel one as the other when comparing suppliers or batches.
What information does mass spectrometry add?
Mass spectrometry provides information about ions, while tandem mass spectrometry adds fragment information that can help examine structure. In an angiotensin I investigation, researchers compared measured and calculated masses and used fragmentation data to characterize related peptide impurities. That is a more specific identity question than the size of a UV peak (Stoppacher et al., 2013).
Ask whether a report presents an intact-mass match, a fragment-based assignment, or another identification result. Those descriptions should not be collapsed into the same vague word, “confirmed.” Keep the stated evidence and any limitations with the identity conclusion.
Is a chromatographic fraction always one compound?
Not necessarily. In the peptide-standard study, a collected fraction contained ions assigned to related impurities, and the main peptide was also observed there. The authors considered material from the tail of the main peak a likely explanation. The paper does not call that observation proof of universal co-elution, so neither should a summary (Preston and Phillips).
The practical reading lesson is to distinguish a labelled fraction from a demonstrated chemical identity. If several assignments appear under the same collected fraction, retain that information. A simplified graph should not erase the accompanying spectral analysis.
What does LC-MS or LC-MS/MS mean in this comparison?
The methods can be combined rather than viewed as competing alternatives. Stoppacher and colleagues used liquid chromatography with high-resolution tandem mass spectrometry to detect and characterize impurities in the same analysis. Their paper then used calibration to estimate impurity amounts, showing that identification and quantification were connected but distinct parts of the work (original study).
When a report names a combined method, ask which part of the result addresses your question. A structural assignment is not automatically a complete content measurement, and a quantified impurity is not automatically a survey of every possible substance in the material. Read the specified scope rather than expanding the method name into a blanket assurance.
What the evidence actually shows
A peptide-standard experiment: Preston and Phillips studied the labelled peptide iT3 and a chemically modified form. In one comparison, three iT3 stocks were each analyzed in triplicate. The endpoints included detector responses, peptide concentration estimates and impurity assignments. The paper does not state an overall experiment duration; instrument timings are not a follow-up period. See the 2016 publication.
An angiotensin I impurity study: the 2013 investigation estimated major impurities at 10.4 mg/g in a candidate reference material. The authors reported that failing to correct for them would create a 1% error in concentration determination by amino acid analysis. The abstract does not state an overall sample count or duration. These are analytical findings for that material, not market-wide estimates (primary abstract).
An angiotensin II reference-material study: a 2018 investigation combined complementary measurement approaches and assigned a final value of 691 ± 9 mg/g, with the uncertainty reported at k = 2. The abstract also describes a counter-ion contribution of nearly 25% by mass. It gives neither an overall sample count nor a study duration. This is a material-characterization result, not an HPLC peak-area percentage (primary publication).
How this relates to research materials
When reviewing an item in the ETHOS research peptide catalogue, separate the listing identity, chromatographic result, mass-spectral assignment and content measurement in your notes. The earlier guide to reading a peptide COA explains how to match those records to the lot number.
ETHOS uses “8X tested” to mean eight distinct tests before a batch ships, with COAs searchable by lot in the public portal. This article does not identify the eight assays or assign the methods in the cited papers to an ETHOS batch. Our explanation of what 8X tested means keeps that distinction explicit.
Keep the report with the label and documented storage requirements. If your research question concerns stability after storage, request evidence that addresses the relevant conditions and time period. A result from one sample should not be repurposed as an unsupported statement about every later condition.
For a specific example of why a structural assignment needs more than a related name, read our TB-500 and thymosin beta-4 naming guide. It distinguishes published full-length sequence work from a fragment identification.
Frequently asked questions
Does a large HPLC peak prove the compound is correct?
No. Peak size describes detector response. Identity requires its own evidence, as illustrated by the spectral assignments in the peptide-standard study.
Does a matching mass establish the amount in a vial?
No. Identification and quantitative measurement are separate questions; the angiotensin I study used calibration to estimate impurity amounts.
Should I compare area percentage directly with mg/g?
No. They describe different quantities. The 2018 reference-material study reports a mass-based value, not a chromatographic area percentage.
Where should I check an ETHOS batch?
Use the vial’s lot number in the public COA portal, match the named material, and ask for clarification if a measurement is missing or unclear.
Research use only. ETHOS materials are for laboratory research, not human or veterinary use. This article explains analytical evidence and documentation, not product effects or advice on use.
Frequently asked questions
Does a large HPLC peak prove the compound is correct?
No. Peak size describes detector response. Identity requires its own evidence, as illustrated by the spectral assignments in the peptide-standard study .
Does a matching mass establish the amount in a vial?
No. Identification and quantitative measurement are separate questions; the angiotensin I study used calibration to estimate impurity amounts.
Should I compare area percentage directly with mg/g?
No. They describe different quantities. The 2018 reference-material study reports a mass-based value, not a chromatographic area percentage.
Where should I check an ETHOS batch?
Use the vial's lot number in the public COA portal, match the named material, and ask for clarification if a measurement is missing or unclear.